What a 1Gbps or 10Gbps Port Actually Delivers: Throughput, Overheads, and Real-World Speed
When a hosting provider advertises a dedicated server network speed of 1 Gbps or 10 Gbps, the number refers to the line rate of the physical network interface card installed in your server — the maximum bitrate at which the NIC can transmit symbols onto the wire. It does not mean your server will push 1,000 or 10,000 megabits of actual payload data per second to end users, because every layer of the networking stack consumes a portion of that raw line rate for protocol overhead. Ethernet framing consumes approximately 1.6% to 2.4% of line rate (the inter-frame gap, preamble, and frame check sequence). IP headers consume another 0.8% to 2% depending on whether IPv4 or IPv6 is in use and whether IP options are present. TCP headers consume roughly 1.5% to 5% depending on timestamp and selective-acknowledgement option usage. TLS encryption, if your application serves HTTPS traffic, adds its own per-session and per-record overhead. The cumulative effect is that a 1 Gbps port delivers roughly 940 to 960 Mbps of usable TCP payload throughput under optimal conditions — approximately 118 to 120 MB/s — and a 10 Gbps port delivers roughly 9.4 to 9.6 Gbps, or approximately 1.18 to 1.20 GB/s. The gap between interface speed and usable throughput is not a flaw in the provider's infrastructure; it is an inescapable consequence of the protocol stack that every TCP/IP network on earth operates under, and benchmarking tools like iperf3 account for it automatically by reporting goodput rather than line rate.
The distinction between megabits per second (Mbps) and megabytes per second (MB/s) remains one of the most persistent sources of confusion in hosting bandwidth discussions. Network speeds are universally expressed in bits per second — 1 Gbps equals 1,000 Mbps — while file sizes, database exports, backup archives, and application payloads are measured in bytes. One byte equals eight bits, so 1 Gbps of goodput translates to approximately 120 MB/s of file transfer speed, and 10 Gbps translates to approximately 1.2 GB/s. This is the number that matters when you are calculating how long it will take to transfer a 50 GB database dump to an off-site backup server or how many simultaneous 4K video streams your server can serve before the network interface becomes the bottleneck. A common miscalculation among first-time dedicated server buyers is to assume that a 1 Gbps port means they can serve 1 GB of content per second, when in reality the per-second capacity is closer to 120 MB — roughly one-eighth of the number that the "giga" prefix intuitively suggests. For readers encountering dedicated server infrastructure for the first time, our dedicated server guide explains the hardware fundamentals — CPU, RAM, storage, and networking — that contextualise bandwidth as one dimension of a complete server specification rather than an isolated metric.
The network interface card inside a dedicated server is not the only factor determining end-to-end throughput. The switch port your server connects to, the switching fabric's backplane capacity, the provider's upstream transit and peering arrangements, the congestion levels on those upstream links, the TCP congestion control algorithm in your server's kernel, the latency between your server and your users, and the TCP receive window sizes configured on both ends all participate in determining the actual throughput any single connection achieves. A server with a 10 Gbps NIC connected to a top-of-rack switch that is itself connected to the data centre's core router via a 40 Gbps or 100 Gbps uplink that then traverses multiple autonomous systems across the public internet before reaching a user on a home broadband connection will almost never achieve 10 Gbps of throughput to that single user, because the end-to-end path's capacity is the minimum of every link in the chain. The 10 Gbps port speed matters for aggregate throughput — handling thousands of simultaneous users whose combined bandwidth demand approaches or exceeds 1 Gbps — not for single-stream throughput to any individual user. This distinction between interface speed and realised single-stream throughput is critical because it determines whether upgrading from 1 Gbps to 10 Gbps will actually solve your specific performance problem, or whether the bottleneck lies elsewhere in the network path.
Shared Ports vs Dedicated Ports: Why the Fine Print Changes Everything
The most consequential distinction in dedicated server network speed provisioning — and the one that budget providers exploit to advertise 10 Gbps connectivity that performs like 300 Mbps — is the difference between a dedicated port and a shared port. A dedicated port means the physical switch port your server connects to, and the bandwidth capacity provisioned on that port, are allocated exclusively to your server. If you order a dedicated 1 Gbps port, the switch port is configured to rate-limit egress and ingress to 1 Gbps, and no other server's traffic contends for that capacity. If you order a dedicated 10 Gbps port, you receive the full 10 Gbps of switching capacity allocated to your machine alone, with the provider's network engineered to ensure that the oversubscription ratio — the ratio of total customer port capacity to upstream transit capacity — is low enough that your 10 Gbps port is not meaningless during peak usage hours. Dedicated ports deliver consistent, predictable throughput because the capacity allocation is hard, not statistical.
A shared port, sometimes euphemistically labelled "10 Gbps shared" or "10 Gbps port with fair-use policy," means that your server's physical NIC may negotiate at 10 Gbps, but the switch port is oversubscribed — multiple servers share a single uplink of, for example, 10 Gbps to the core router. If ten servers each have a "10 Gbps shared" connection and all ten attempt to push traffic simultaneously, each effectively receives roughly 1 Gbps of core network capacity, assuming equal distribution. In practice, distribution is rarely equal — a single server running a high-traffic streaming workload can consume a disproportionate share of the shared uplink, starving neighbouring servers. Providers use shared ports to offer superficially impressive bandwidth specifications at low prices because the statistical multiplexing of shared capacity allows them to sell more aggregate port capacity than they have upstream transit capacity, betting that not all customers will use their ports simultaneously. This bet is often correct — most servers idle at low bandwidth utilisation most of the time — but it produces a fundamentally different quality of service than a dedicated port, where your bandwidth is guaranteed regardless of what other customers are doing. The distinction between shared and dedicated port models is explored in greater detail through the lens of resource guarantees across hosting types in our cloud-vs-dedicated comparison, which examines how resource isolation differs between virtualised and bare-metal environments.
The shared-port model becomes particularly problematic at the 10 Gbps tier because the gap between the advertised number and the realised throughput can be enormous. A provider offering a "10 Gbps port" for $80/month on a dedicated server is almost certainly provisioning a shared port — the transit and switching infrastructure required to deliver a genuine dedicated 10 Gbps port costs the provider far more than $80/month in raw bandwidth and amortised hardware, making a genuine dedicated 10 Gbps port economically impossible at that price point. The giveaway is in the acceptable use policy or the bandwidth fair-use clause: language about "sustained usage above X% may result in throttling," "bandwidth is shared among all customers in the rack," or "maximum sustained throughput is 1 Gbps" buried in the terms of service. A genuine dedicated 10 Gbps port from a reputable provider will state explicitly that the port is dedicated, list the committed information rate (CIR), and not include language about fair-use throttling based on sustained utilisation. Before evaluating port speeds, verify whether the port you are being offered is dedicated or shared — the difference can be the equivalent of a 10× effective throughput multiplier or divisor, dwarfing the significance of the nominal speed itself.
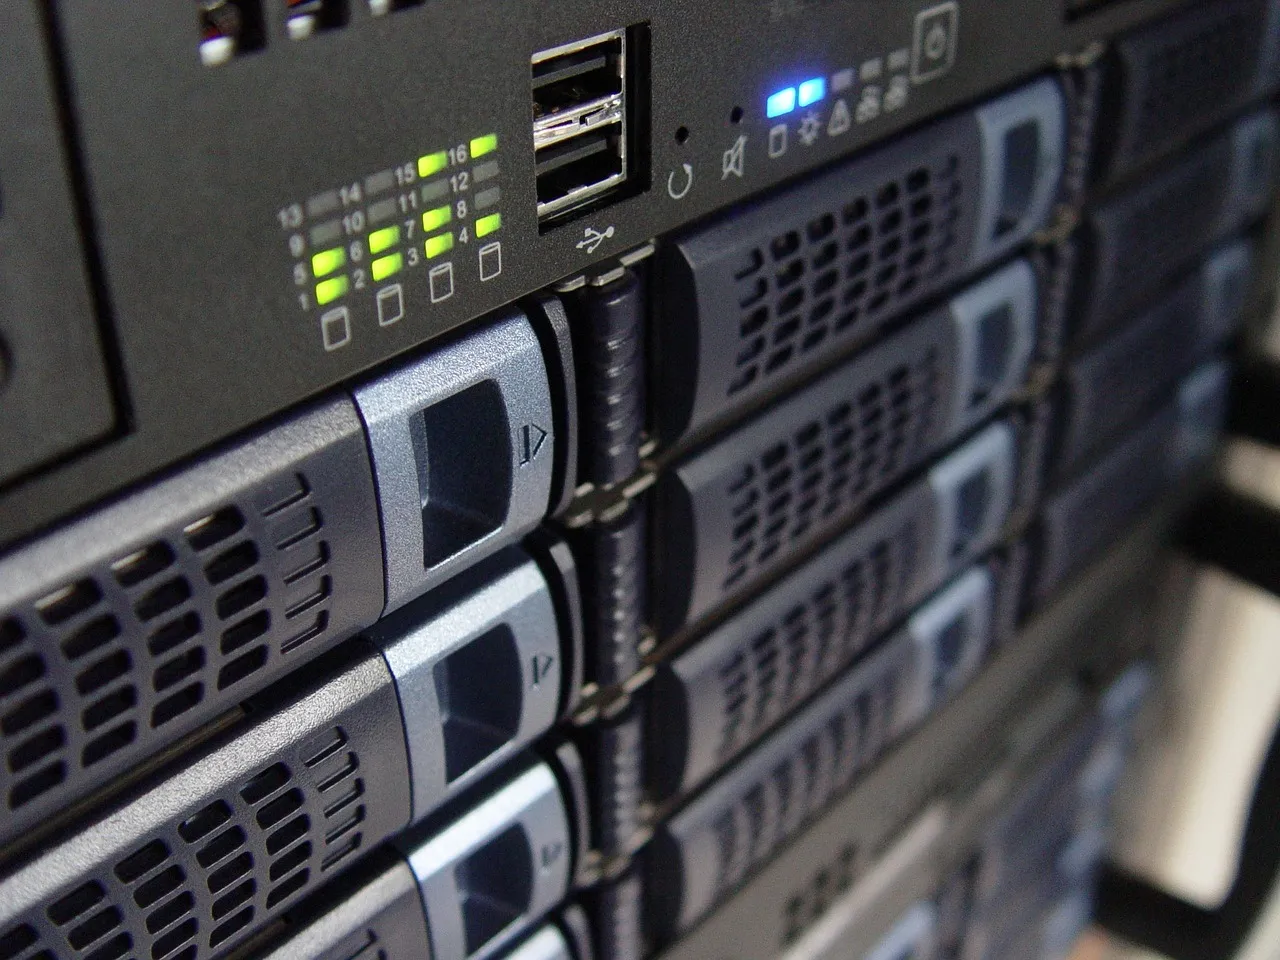
Illustration: Dedicated Server Network Speed: Understanding 1Gbps vs 10Gbps PortsBurstable Bandwidth vs Guaranteed Bandwidth: The 95th Percentile Billing Model
Beyond the dedicated-versus-shared distinction, dedicated server network speed provisioning operates on a spectrum from fully guaranteed bandwidth to burstable bandwidth with varying commitment levels. Guaranteed bandwidth — sometimes called committed information rate or CIR — means the provider contractually commits that your server can sustain the specified throughput 24/7 without throttling, deprioritisation, or overage charges. If you purchase a dedicated 1 Gbps port with guaranteed bandwidth, you can push 940 Mbps of TCP traffic continuously, every hour of every day, for the entire billing cycle, and the provider's network will deliver that throughput without complaint. Guaranteed bandwidth is what you want for production workloads where consistent performance is non-negotiable: e-commerce checkout flows, financial transaction processing, real-time API endpoints serving mobile applications, and any workload where a bandwidth dip during peak hours directly translates to lost revenue or degraded user experience.
Burstable bandwidth, by contrast, allows your server to exceed a baseline committed rate for short periods, drawing from a "burst credit" pool that accumulates during periods of low utilisation. The most common burstable model is the 95th percentile billing method, widely used in data centre and colocation pricing. Under 95th percentile billing, the provider samples your port's throughput at regular intervals — typically every five minutes — across the billing month, discards the highest 5% of samples, and bills you based on the 95th percentile value. This model effectively gives you free bursts during the highest-utilisation 36 hours of the month (5% of 720 hours in a 30-day month), which accommodates short traffic spikes — a product launch, a viral social media post, a DDoS attack — without permanently increasing your bill. The flip side is that if your sustained throughput increases and the 95th percentile rises, your bill increases accordingly, typically in tiers (e.g., $10 per additional Mbps above the commit). For workloads with predictable traffic patterns, 95th percentile billing can be substantially cheaper than purchasing guaranteed bandwidth at the peak rate, because you are only paying for the sustained baseline plus occasional bursts rather than paying for the peak capacity 24/7. For workloads with unpredictable, spiky traffic, the 95th percentile model can produce billing surprises that exceed the cost of simply buying guaranteed bandwidth at a higher commit level. Understanding your traffic pattern — the ratio of peak-hour to average-hour throughput, the frequency and duration of spikes, and the revenue sensitivity of bandwidth throttling — is essential before choosing between a guaranteed and burstable bandwidth model.
Some providers blur the guaranteed-versus-burstable distinction by offering "unmetered" ports — a fixed monthly price for a port with no metering or overage charges regardless of utilisation. An unmetered 1 Gbps port means you pay a flat fee, typically $200 to $500 per month depending on the provider and data centre location, and you can push 1 Gbps continuously without additional charges. An unmetered 10 Gbps port is substantially more expensive — typically $1,000 to $3,000+ per month — reflecting the higher transit and switching costs the provider incurs. Unmetered pricing eliminates billing uncertainty and is ideal for bandwidth-intensive workloads with sustained high utilisation: video streaming platforms, content delivery origins, game server fleets, file hosting services, and backup repositories. The tradeoff is that unmetered ports are almost never available at the budget end of the dedicated server market because the provider cannot sustain the transit costs at low monthly prices. If you see an unmetered 10 Gbps port offered for $150/month, the port is either shared (not dedicated), subject to a hidden fair-use throttle, or the provider is taking a loss on that customer in the hope of upselling other services — a strategy that is unlikely to be sustainable over the multi-year lifespan of a typical dedicated server deployment.
When a 1Gbps Port Is More Than Enough for Your Workload
The majority of dedicated server workloads operate comfortably within the capacity of a dedicated 1 Gbps port, and identifying whether your workload falls into this category can save you $100 to $1,000+ per month compared to unnecessarily purchasing a 10 Gbps port. A 1 Gbps port serves approximately 120 MB/s of TCP goodput, which translates to roughly 10,000 to 15,000 simultaneous HTTP requests per second for a typical PHP/MySQL website serving dynamic content with an average page weight of 1 to 2 MB — far more traffic than the vast majority of small and mid-size business websites ever experience, even during seasonal peaks. An e-commerce site with 50,000 monthly visitors, each browsing an average of 6 pages per session, generates approximately 300,000 page views per month, or roughly 0.12 page views per second averaged across the month. Even a 100× traffic spike during a Black Friday sale would push that to 12 page views per second — a fraction of what a 1 Gbps port can deliver. For context on what dedicated infrastructure means for growing operations, our dedicated server guide maps typical traffic volumes to hardware specifications so you can correlate your visitor analytics with appropriate server sizing.
Content-heavy websites — media publishing platforms, corporate marketing sites with image galleries, documentation portals with screenshots — represent a more bandwidth-intensive profile but still rarely saturate a 1 Gbps port at small to mid-size traffic levels. If your average page weight is 5 MB (substantially heavier than the web average of approximately 2.5 MB) and you serve 200,000 page views per day — roughly 7.3 million page views per month, which places you in the top 1% of websites by traffic — your average throughput is approximately 93 Mbps, well within the 940 Mbps capacity of a 1 Gbps port. Peak-hour throughput might reach 300 to 500 Mbps if your traffic is concentrated in specific time windows, which still leaves substantial headroom. The workloads that genuinely need more than 1 Gbps are those where bandwidth consumption is sustained, not spiky: video streaming at high bitrates, large-file downloads (software distribution, game patches, creative asset delivery), real-time data replication between database clusters, and any application where the per-user bandwidth consumption multiplied by the concurrent user count exceeds the port capacity on a sustained basis.
Database-driven applications — ERP systems, CRM platforms, custom line-of-business applications — are constrained more by storage I/O and CPU capacity than by network bandwidth in most deployments. A MySQL or PostgreSQL server processing 5,000 OLTP transactions per second, where each transaction involves querying a few kilobytes of data and returning a few kilobytes of results, generates roughly 50 to 100 Mbps of database protocol traffic — an order of magnitude less than a 1 Gbps port's capacity. The network interface is almost never the bottleneck for database workloads; the storage subsystem's IOPS and latency, the CPU's ability to process concurrent queries, and the efficiency of the application's query patterns dominate the performance profile. Upgrading to a 10 Gbps port for a database server that is CPU-bound or I/O-bound will not improve performance and will add unjustified monthly cost. The one database scenario where 10 Gbps becomes relevant is database replication across geographically distributed nodes — replicating a 500 GB dataset that changes by 50 GB per day across a wide-area network benefits substantially from a faster port because the replication window directly affects the recovery point objective and the amount of data at risk during a primary node failure.
The most pragmatic approach to determining whether 1 Gbps is sufficient is to monitor your actual bandwidth utilisation before making a port speed decision. Tools like vnstat, iftop, nload, and bmon provide real-time and historical bandwidth utilisation data directly on your server. Most server monitoring platforms — Netdata, Prometheus with node_exporter, Datadog, New Relic — include network throughput metrics that can be graphed over days, weeks, and months. Examine your 95th percentile throughput over a representative period that includes your peak traffic season. If your 95th percentile throughput is below 500 Mbps and your peak-hour spikes rarely exceed 800 Mbps, a 1 Gbps dedicated port provides comfortable headroom. If your 95th percentile throughput consistently exceeds 700 Mbps and your peak-hour utilisation approaches 900+ Mbps, you are approaching the practical limit of a 1 Gbps port and should begin evaluating a 10 Gbps upgrade — not because the port will stop working, but because TCP performance degrades as utilisation approaches line rate due to increased buffer pressure, higher latency, and reduced headroom for traffic bursts. Network performance tuning for dedicated servers is part of a broader infrastructure optimisation strategy that touches on how hardware choices map to real-world application outcomes — a topic our big data hosting analysis explores in the context of data-intensive workloads where network throughput is a primary design constraint.
When You Genuinely Need a 10Gbps Port and How to Justify the Upgrade
The upgrade from 1 Gbps to 10 Gbps on a dedicated server network speed configuration is one of the more expensive single-line-item changes in a hosting budget — typically adding $100 to $1,000+ per month — and it should be justified by a specific, measurable bandwidth requirement that a 1 Gbps port cannot satisfy rather than by a general desire for "faster" infrastructure. The workloads that genuinely need 10 Gbps share a common characteristic: they push sustained, high-volume data transfers that would be constrained — not slightly inconvenienced but materially bottlenecked — by a 1 Gbps ceiling. Identifying these workloads requires translating your application's data flow into bits per second and comparing that figure honestly against the 940 Mbps of usable throughput a 1 Gbps port provides.
Video streaming platforms are the canonical 10 Gbps workload, and the bandwidth math is straightforward. A single 1080p video stream encoded with H.264 at a typical bitrate of 5 Mbps consumes 5 Mbps of server egress bandwidth. At 1 Gbps, you can serve approximately 188 simultaneous 1080p streams before the port saturates. For 4K content encoded at 25 Mbps, that number drops to approximately 37 simultaneous streams. If your platform targets 1,000 concurrent viewers, even at 1080p quality, you need approximately 5 Gbps of egress capacity — comfortably beyond a 1 Gbps port. Live streaming amplifies the demand because all viewers watch simultaneously (unlike on-demand streaming where viewership is distributed across time), meaning your peak bandwidth requirement equals your peak concurrent viewer count multiplied by your stream bitrate. A live event with 5,000 concurrent viewers at 1080p consumes 25 Gbps — beyond even a single 10 Gbps port and requiring either multiple servers behind a load balancer or a content delivery network that absorbs the egress burden at the edge. For context on how cloud infrastructure can complement dedicated servers for variable workloads, our cloud providers for SMBs analysis examines hybrid architectures that combine dedicated hardware for baseline capacity with cloud elasticity for peak traffic absorption.
Large-file delivery — software distribution, game patch downloads, creative asset transfer for video production and 3D rendering workflows, scientific dataset sharing — represents another workload class where 10 Gbps directly translates to user experience. A 50 GB game patch downloaded by 10,000 users on launch day generates 500 TB of total egress. On a 1 Gbps port, serving that egress sequentially would take approximately 46 days — clearly untenable. Even with a content delivery network absorbing most of the egress, the origin server must push the data to the CDN's edge nodes, and a 1 Gbps port becomes the bottleneck on how quickly the CDN can ingest and distribute the content. A 10 Gbps port reduces the origin-to-CDN ingestion time by a factor of ten, enabling faster global propagation of large content updates. Similarly, off-site backup and disaster recovery workflows benefit substantially from 10 Gbps: transferring a 10 TB database backup to a geographically distant server for disaster recovery takes approximately 23 hours on a 1 Gbps port (assuming full line-rate utilisation) but only 2.3 hours on a 10 Gbps port. For businesses with recovery time objectives measured in single-digit hours, this difference can be the determining factor in whether the DR strategy meets its RTO target.
Real-time big data processing — ingesting streaming data from IoT devices, processing financial market data feeds, or running distributed analytics queries across a data lake — represents an emerging workload category where 10 Gbps ports are transitioning from luxury to necessity. A Hadoop or Spark cluster where each node processes a shard of a petabyte-scale dataset achieves its performance by moving data across the network as fast as the nodes can process it. The "shuffle" phase in a MapReduce job — where intermediate data is redistributed across nodes — is particularly network-intensive, and a 1 Gbps inter-node link becomes a severe bottleneck that leaves CPU cores idle while they wait for data to arrive. Similarly, GPU clusters used for distributed AI training — where gradient synchronisation across nodes occurs after every training step — are exquisitely sensitive to inter-node network bandwidth because the GPUs cannot proceed to the next training step until all nodes have exchanged their gradients. For eight nodes each with eight H100 GPUs training a large language model, the gradient exchange can easily exceed 10 Gbps, making 25 Gbps, 40 Gbps, or 100 Gbps interconnects (InfiniBand or RoCE) the standard rather than the exception. Our AI workloads analysis explores the hosting implications of these emerging compute and network demands in greater detail, including the infrastructure changes that AI training and inference impose on data centre network design.
High-traffic content websites and API endpoints serving millions of requests per day can also justify a 10 Gbps upgrade, though here the bottleneck is more commonly aggregate request volume than per-request bandwidth. A REST API endpoint that serves JSON responses averaging 10 KB and handles 50,000 requests per second generates approximately 4 Gbps of egress — beyond a 1 Gbps port but well within 10 Gbps. Before upgrading the port, however, verify that the bottleneck is genuinely the network interface and not the application's ability to generate 50,000 responses per second — which requires substantial CPU capacity, efficient database query patterns, and likely a distributed caching layer. Many teams upgrade to 10 Gbps expecting a performance improvement only to discover that the application was CPU-bound and the faster port sits underutilised while the CPU queue depth remains the actual constraint. Monitoring TCP retransmission rates, interface queue drops (visible via `ip -s link show` or `netstat -i`), and softirq CPU consumption on the server can help distinguish a genuine network bottleneck from an application or CPU bottleneck that coincidentally manifests as a bandwidth limitation.
How Network Port Speed Affects Real Workloads: Streaming, E-Commerce, CDN, and Backup Use Cases
The impact of dedicated server network speed on real-world workloads is most concretely understood through specific use cases where the port speed is the active constraint — the component that determines whether the application meets its performance targets or fails to deliver acceptable user experience. Each workload class below has a characteristic bandwidth profile that maps to a minimum port speed requirement, and understanding these profiles lets you make provisioning decisions based on your actual workload rather than on abstract bandwidth numbers.
For streaming platforms — whether video-on-demand like a Netflix-style catalogue or live streaming like a Twitch-style broadcast — the port speed calculation is a multiplication of concurrent viewers and per-stream bitrate. A platform serving 500 concurrent viewers at 1080p (5 Mbps) needs 2.5 Gbps of egress capacity at peak. This comfortably exceeds a 1 Gbps port and requires either a 10 Gbps port, a content delivery network that absorbs the majority of egress at the edge, or a multi-server origin architecture with a load balancer distributing the streaming sessions across multiple 1 Gbps servers. Live streaming is particularly demanding because viewership concentrates in time — a concert, sports event, or product launch draws thousands of simultaneous viewers — and the platform cannot cache or pre-distribute content to smooth the bandwidth curve. The origin server must handle the peak concurrency, and if the port saturates, the result is not a graceful degradation (lower bitrate) but buffering, disconnections, and a user experience that drives viewers to competitors. For platforms building or scaling streaming infrastructure, the port speed decision should be made based on the peak concurrent viewer target, not the average, because the business damage occurs at peak, not at average.
E-commerce platforms present a different bandwidth profile: the per-request data volume is relatively low (product pages with images total 2 to 5 MB, checkout API calls are a few kilobytes), but peak traffic during sales events can spike to 50× to 100× the baseline. A 1 Gbps port can handle approximately 2,000 to 4,000 page views per minute for a typical e-commerce site with a 3 MB average page weight — more than enough for a store doing $2 million to $5 million in annual revenue. However, during a flash sale or Black Friday event, that same store might experience 50,000 visitors in a single hour, pushing the bandwidth requirement to 3 to 5 Gbps at peak. The e-commerce workload is therefore a strong candidate for a burstable bandwidth model: provision a 1 Gbps guaranteed port with 95th percentile billing that accommodates bursts to 3 to 5 Gbps during the 36 peak hours of the month, without paying for a dedicated 10 Gbps port that would be underutilised for the remaining ~700 hours. The key is to negotiate the burst capability upfront — many providers allow bursts above the committed rate with a defined overage rate — rather than discovering during the sales event that the port hard-caps at 1 Gbps and your checkout pages are timing out.
Content delivery network origin servers occupy a unique position in the bandwidth discussion because their primary function is to serve as the authoritative source that edge nodes pull from when cached content expires or is absent. A CDN reduces the egress burden on the origin server dramatically — often by 90% to 99% for cacheable content — but the remaining origin traffic can still be substantial for large catalogues with high churn. If your CDN edge nodes collectively pull 200 TB of content from your origin server per month, the average throughput is approximately 620 Mbps — comfortably within 1 Gbps. But the pull pattern is rarely smooth: when you publish a major content update, invalidate a large cache segment, or onboard a new edge region, the CDN nodes pull content in parallel bursts that can momentarily exceed 1 Gbps. A 10 Gbps origin port smooths these ingestion bursts, reducing the time required for content to propagate globally and ensuring that users in newly served regions receive fast cache-fill times. For content platforms where freshness matters — news sites, financial data platforms, live score services — the faster cache-fill provided by a 10 Gbps origin port directly improves the user-perceived freshness of the content. An external perspective on CDN and edge caching architecture fundamentals is available in this Cloudflare cloud infrastructure overview, which explains how origin servers, edge nodes, and caching policies interact to determine end-to-end content delivery performance.
Backup and disaster recovery workflows represent a workload where port speed has linear, predictable impact on a critical business metric: the recovery time objective. Transferring a 2 TB database backup to an off-site location for DR purposes takes approximately 4.7 hours on a 1 Gbps port at full utilisation, or approximately 28 minutes on a 10 Gbps port. If your RTO is 1 hour, the 1 Gbps port cannot meet it for a 2 TB dataset, while the 10 Gbps port can. This calculation becomes more complex when you factor in incremental versus full backups, compression ratios, and the time required to restore and validate the backup at the destination — the network transfer is one component of the end-to-end recovery time — but for large datasets, the network transfer dominates the RTO and the port speed directly determines whether the recovery SLA is achievable. Another dimension of the hosting infrastructure landscape that affects backup and DR strategy is the environmental sustainability of data centre operations — our green cloud analysis examines how energy efficiency in data centres intersects with infrastructure design decisions, including the power and cooling implications of high-bandwidth networking hardware that operates at 10 Gbps and above.
How to Test Your Dedicated Server Network Speed Accurately
Testing dedicated server network speed accurately requires using tools and methods that measure TCP goodput rather than raw interface statistics, that control for variables like disk I/O and CPU bottlenecks, and that test across a range of geographic destinations to capture the real-world path diversity your users experience. A single iperf3 test to a speed-test server in the same data centre will report near-line-rate throughput and create a false sense of network adequacy; a test to a destination 10,000 kilometres away across a congested transit path will report dramatically lower throughput and create a false sense of network inadequacy. Accurate network speed assessment requires a systematic testing methodology that isolates the server's port capacity from the performance characteristics of the paths between your server and your users.
The foundational tool for dedicated server bandwidth testing is iperf3, a client-server application that generates TCP or UDP traffic streams and reports achieved throughput. To test your server's egress capacity (upload speed), run iperf3 in client mode on your server and connect to a public iperf3 server or a server you control in a different data centre: `iperf3 -c -P 4 -t 30`. The `-P 4` flag opens four parallel TCP streams, which is important because a single TCP stream is often limited by the bandwidth-delay product and the receive window configuration rather than by the port speed, especially on high-latency paths. The `-t 30` flag runs the test for 30 seconds, long enough to pass TCP slow-start and reach a stable congestion window. To test ingress capacity (download speed), run iperf3 in server mode on your dedicated server (`iperf3 -s`) and connect to it from an external client with the `-R` flag to reverse the direction of data flow. Run tests to multiple geographically diverse destinations — within the same data centre, within the same metropolitan area, to a different continent — to understand how latency and path characteristics affect the throughput your users will actually experience.
Public speed-test servers provide a convenient external reference point but should be interpreted with caution. Servers listed on iperf3-public server directories are frequently overloaded (their own 10 Gbps ports are shared among hundreds of simultaneous testers) and the throughput they report may reflect their own congestion rather than your server's port capacity. A more reliable approach is to provision a small cloud VPS instance with a known port speed (e.g., a cloud instance with a 5 Gbps network tier) in the target geographic region and run iperf3 between your dedicated server and the VPS — a controlled experiment where you know the capacity and utilisation of both endpoints. This approach costs a few dollars for the VPS runtime but provides unambiguous data about the throughput achievable on the path between your provider's data centre and the cloud region you are testing against.
Beyond synthetic benchmarks, real-world throughput testing using your actual application payloads provides the most operationally relevant data. Use curl or wget to download a large test file from your server to a machine in a representative user location, measuring the transfer rate reported by the tool. Use rsync with the `--progress` flag to simulate a backup transfer and observe the sustained throughput. For HTTP-based workloads, tools like wrk, ab (ApacheBench), or hey can generate concurrent HTTP requests while you monitor the server's egress throughput with vnstat or iftop, revealing whether the port saturates at a specific request concurrency level. The goal is not to achieve a specific benchmark number — it is to determine whether your port speed is sufficient for your workload's peak demand with a comfortable safety margin, typically 30% to 50% headroom above your observed peak throughput to accommodate traffic surges and background tasks.
When interpreting speed test results, be aware of the most common confounding factors. CPU bottleneck: if your server's CPU utilisation approaches 100% during an iperf3 test, the reported throughput reflects CPU capacity, not port speed — iperf3 is CPU-intensive and can become the bottleneck on servers with older or lower-core-count processors. Disk I/O bottleneck: if you are testing with file-based transfers and your storage subsystem cannot read or write at the port's line rate, the reported throughput reflects storage performance, not network performance. Network congestion at the destination: a speed test to a server in a different data centre measures the performance of the entire path, including transit links you do not control, and the result reflects the minimum-capacity link along that path — which may be a congested peering point, not your server's port. Virtualisation overhead: if testing a cloud instance, the hypervisor's network virtualisation layer (virtio, SR-IOV, or ENA) introduces overhead and variance that does not exist on bare-metal dedicated servers, making cloud-to-cloud speed tests a poor proxy for dedicated server port performance. Testing methodology and accurate interpretation are especially important for AI hosting workloads, where large model downloads and distributed training data transfers place extreme demands on network infrastructure — our AI hosting introduction provides additional context on the network requirements that differentiate AI infrastructure from conventional web and application hosting.
The Cost Premium for 10Gbps: What to Budget and Where Providers Differ
The price difference between a 1 Gbps port and a 10 Gbps port on a dedicated server is one of the largest single-line-item cost drivers in a hosting budget, and understanding the cost structure behind the premium — rather than simply comparing provider price lists — helps distinguish between reasonable pricing, aggressive discounting that signals a shared or burstable port, and premium pricing that reflects genuine dedicated 10 Gbps infrastructure with guaranteed throughput. The cost premium exists because 10 Gbps infrastructure costs the provider more at every level: the switch ports themselves are more expensive (a 24-port 10GbE top-of-rack switch costs $5,000 to $15,000, versus $1,000 to $3,000 for a 48-port 1GbE switch), the upstream transit and peering capacity must be scaled proportionally, the fibre cabling infrastructure (SFP+ or QSFP+ optics, single-mode or multi-mode fibre patches) is more expensive per port, and the network engineering and monitoring burden increases with the higher data rates. These provider-side costs are passed through to the customer, and they scale roughly linearly with port speed — a dedicated 10 Gbps port costs the provider approximately 5× to 10× what a dedicated 1 Gbps port costs, depending on the provider's transit mix, peering relationships, and equipment amortisation schedules.
In the dedicated server market as of 2026, a dedicated 1 Gbps unmetered port typically adds $100 to $300 per month above the base server rental, with pricing determined primarily by the data centre location (bandwidth is more expensive in Asia-Pacific and South America than in North America and Europe due to transit market maturity and submarine cable capacity), the provider's transit mix (providers with extensive peering at internet exchanges can offer lower prices than providers who must purchase all their upstream capacity from transit providers), and whether the bandwidth commitment includes DDoS mitigation (which adds approximately $50 to $200 per month depending on the mitigation capacity). A dedicated 10 Gbps unmetered port typically adds $800 to $2,500+ per month above the base server rental, with the wide range reflecting the same variables as the 1 Gbps pricing plus the additional factor of whether the provider has native 10 Gbps infrastructure throughout their network or whether they are aggregating multiple 1 Gbps links to simulate a 10 Gbps port.
Metered bandwidth pricing — where you pay for a specific committed data transfer volume rather than an unmetered port — follows a different cost curve. A dedicated 1 Gbps port with a 10 TB monthly transfer allowance might add $50 to $150 per month to the server rental, with overage charges of $0.01 to $0.05 per GB. A dedicated 10 Gbps port with a 50 TB or 100 TB monthly transfer allowance might add $300 to $800 per month. For workloads with predictable, consistent bandwidth consumption, metered pricing with an appropriate commit level is often cheaper than unmetered pricing because you are not paying for capacity you do not use. The risk is that a traffic surge — a successful marketing campaign, a viral content piece, or a DDoS attack — generates overage charges that exceed the cost of an unmetered port. Mitigating this risk requires either traffic monitoring with alert thresholds that notify you before overage charges accumulate, or negotiating a burstable commit where you pay a fixed price for the committed volume plus a reduced overage rate for bursts above the commit.
The budget dedicated server segment — providers offering servers at $50 to $100 per month — almost universally provisions shared 1 Gbps ports, and any mention of 10 Gbps at this price tier should be treated as a shared-port marketing claim rather than a dedicated-port capability. At the mid-range ($150 to $400 per month), you can expect a dedicated 1 Gbps port, often with a generous bandwidth allowance (10 to 30 TB) or unmetered at the higher end of the range. Dedicated 10 Gbps ports are concentrated at the premium tier ($400+ per month for the server alone, plus the bandwidth premium), with providers like Hetzner, OVHcloud, ReliableSite, Hivelocity, and Equinix offering genuine dedicated 10 Gbps connectivity at prices that reflect the infrastructure cost. Our cheap dedicated hosting analysis examines the tradeoffs at each price tier, including how bandwidth allocation quality varies as you move down the price spectrum and which specifications budget providers tend to overstate. For organisations evaluating whether to invest in AI-capable hosting infrastructure — which often demands 10 Gbps or faster networking — our AI hosting overview provides additional context on the infrastructure requirements that make 10 Gbps a baseline rather than a premium feature for certain workload categories.
The HostingCaptain Perspective: Choosing the Right Port Speed for Your Dedicated Server
At HostingCaptain, we have guided hundreds of businesses through the port speed decision, and we have observed that the most common error is not choosing the wrong speed — it is choosing a speed based on an abstract desire for "more" rather than on measured, documented bandwidth requirements. The businesses that make the best port speed decisions are those that instrument their existing infrastructure to collect real throughput data, model their growth projections against that data, and purchase port capacity with a 30% to 50% headroom margin above their projected peak utilisation. They treat the port speed upgrade as a response to evidence — a graph showing sustained 800+ Mbps utilisation during peak hours — rather than as a speculative investment in "future-proofing" that may never be utilised.
For the majority of growing businesses on dedicated servers, a dedicated 1 Gbps port with 95th percentile burstable billing to accommodate traffic spikes is the optimal configuration. It provides sufficient capacity for all but the most bandwidth-intensive workloads, keeps the monthly cost predictable and manageable, and avoids the substantial premium of a dedicated 10 Gbps port that would sit underutilised. The exceptions — video streaming platforms, large-file delivery services, real-time big data processing pipelines, high-traffic API endpoints, and distributed AI training clusters — genuinely benefit from 10 Gbps, and for these workloads the additional cost is justified by the direct improvement in user experience, data processing throughput, and recovery time objectives. The key is honest workload classification: if your server's primary function is serving a business website, an e-commerce platform, or a SaaS application with typical per-user bandwidth consumption, you almost certainly do not need 10 Gbps, and the money saved by staying with 1 Gbps is better invested in faster storage, more RAM, or a better processor — components that will actually improve performance for your workload profile.
For businesses whose workloads genuinely require 10 Gbps, we recommend negotiating the port specification explicitly with the provider before signing a contract. Confirm in writing that the 10 Gbps port is dedicated (not shared), specify the committed information rate or billing model (guaranteed, burstable, unmetered, or metered), and verify that the provider's upstream network has sufficient transit and peering capacity to deliver 10 Gbps to your target audience during peak hours. Ask for a real-world speed test result — an iperf3 test from a server in the provider's data centre to a neutral destination — conducted at a time when the provider's network is under typical production load. A provider confident in their infrastructure will provide this without hesitation. A provider that deflects or provides only synthetic, intra-data-centre test results is signalling that the 10 Gbps claim may not hold up under real-world conditions.
As AI workloads continue to reshape hosting requirements, the importance of network throughput is increasing for a subset of applications that did not previously require high-bandwidth infrastructure. Distributed AI training, real-time inference serving at scale, and large model distribution all demand network capacity that would have been considered excessive for conventional hosting just a few years ago. Our AI workloads analysis examines how these emerging demands are changing the economics and architecture of dedicated server hosting, including the network topology changes that AI infrastructure imposes on data centre design. For businesses building or hosting AI-powered applications, the port speed decision should be informed by the specific network requirements of the AI workloads in question — gradient synchronisation bandwidth for training, inference request throughput for serving, and model distribution bandwidth for deployment — rather than by conventional web hosting bandwidth heuristics that may dramatically underestimate the requirement. The hosting landscape is evolving rapidly, and network capacity is becoming as strategically important as compute capacity for an expanding range of applications — a trend that HostingCaptain is tracking closely as we help our customers navigate the infrastructure decisions that will determine their competitiveness in the AI era.
Frequently Asked Questions About Dedicated Server Network Speed
What is the actual throughput difference between a 1Gbps and 10Gbps dedicated server port?
A dedicated 1 Gbps port delivers approximately 940 to 960 Mbps of usable TCP payload throughput (roughly 118 to 120 MB/s), while a dedicated 10 Gbps port delivers approximately 9.4 to 9.6 Gbps (roughly 1.18 to 1.20 GB/s) — a tenfold difference in practice, just as the nominal numbers suggest. The gap between the interface line rate and the usable throughput is due to protocol overhead from Ethernet framing, IP headers, TCP headers, and TLS encryption, which collectively consume approximately 4% to 6% of the raw line rate. The practical implication is that a 10 Gbps port can handle approximately ten times the simultaneous users, ten times the file transfer speed, and ten times the data replication throughput of a 1 Gbps port, assuming the server's CPU, storage, and memory subsystems are provisioned to sustain that throughput level.
How can I tell if my provider is giving me a shared port instead of a dedicated port?
The most reliable indicators are contractual language and sustained throughput testing. A genuine dedicated port will be described in the service agreement as "dedicated," "guaranteed," or "committed" with a stated information rate. A shared port will use language like "shared," "burstable," "up to," or "fair-use policy applies." To verify in practice, run an iperf3 test from your server to a controlled destination (a VPS you provision with a known port speed in a different data centre) during peak usage hours — typically weekday evenings in the data centre's time zone — and compare the result against the advertised port speed. If the sustained throughput is consistently below 50% of the advertised speed during peak hours, your port is likely shared. Run the same test at off-peak hours (early morning, weekends); if the throughput improves significantly, the shared-port hypothesis is confirmed, because a dedicated port's throughput should not vary significantly with the time of day.
Is a 1Gbps port fast enough for an e-commerce website with 100,000 monthly visitors?
Yes, a dedicated 1 Gbps port provides far more capacity than an e-commerce website with 100,000 monthly visitors requires. At 100,000 monthly visitors averaging 5 page views each with an average page weight of 3 MB, the total monthly egress is approximately 1.5 TB — an average throughput of roughly 5 Mbps, which is less than 1% of a 1 Gbps port's capacity. Even during peak traffic (a flash sale or holiday event), a 10× traffic spike would consume approximately 50 Mbps — still well within the 940 Mbps capacity of a 1 Gbps port. The port speed is unlikely to be the bottleneck for an e-commerce site at this traffic level; server CPU, database query performance, and page caching strategy will have far greater impact on user-perceived performance than the network interface speed.
What network tools can I use to monitor my dedicated server bandwidth usage?
Several lightweight, command-line tools provide real-time and historical bandwidth monitoring directly on a Linux dedicated server. vnstat tracks interface traffic and stores historical data in a database, enabling you to view hourly, daily, and monthly bandwidth totals with the `vnstat -h`, `vnstat -d`, and `vnstat -m` commands. iftop provides a real-time, top-style view of per-connection bandwidth usage. nload displays a simple real-time graph of incoming and outgoing traffic on a specified interface. bmon provides a more detailed, curses-based interface with per-interface statistics. For longer-term monitoring and alerting, tools like Netdata, Prometheus with the node_exporter, and Grafana provide dashboard visualisations of network throughput over days, weeks, and months, with configurable alert thresholds that can notify you when bandwidth utilisation approaches your port's capacity.
Does upgrading from 1Gbps to 10Gbps make my website load faster for individual visitors?
No, upgrading from 1 Gbps to 10 Gbps will not make your website load faster for individual visitors unless your 1 Gbps port was saturated — meaning the port was the bottleneck limiting how quickly your server could transmit data to users. Website load time for an individual visitor is determined by the page's total size divided by the effective throughput of the end-to-end connection between your server and the visitor's device, which is almost always constrained by the visitor's own broadband connection speed (typically 10 to 100 Mbps for home users), the latency of the network path, and the server's ability to generate the page content — not by your server's port speed. A 10 Gbps port benefits aggregate throughput — serving many users simultaneously — not single-user throughput. If your 1 Gbps port is not saturated, upgrading to 10 Gbps will have no measurable effect on individual page load times. If your website feels slow to individual users, the bottleneck is more likely server processing time, database query performance, uncached dynamic content generation, or geographic distance between your server and your users — issues that a faster port will not address.
Which hosting providers offer genuine dedicated 10Gbps ports at reasonable prices?
Several providers have established reputations for delivering genuine dedicated 10 Gbps connectivity at prices that reflect the infrastructure cost without excessive margin. Hetzner offers dedicated 10 Gbps ports across their German and Finnish data centres, with transparent per-server pricing published on their website and the option to provision 10 Gbps during server ordering. OVHcloud offers dedicated 10 Gbps on their higher-tier dedicated server lines (not the budget Kimsufi or SoYouStart brands), with the Anti-DDoS infrastructure included as part of the bandwidth package. In the US market, ReliableSite offers dedicated 10 Gbps unmetered ports on their dedicated server configurations, and Hivelocity provides dedicated 10 Gbps with traffic volume commitments that can be customised to your workload. At the enterprise tier, Equinix offers dedicated 10 Gbps and above through their Equinix Fabric interconnection platform, with SLAs and support levels appropriate for mission-critical workloads. When evaluating any provider's 10 Gbps offering, request a written confirmation that the port is dedicated (not shared), ask for sustained throughput test results from a server in the provider's facility to a neutral external destination, and review the bandwidth terms for any fair-use or throttling clauses that would limit sustained high utilisation.
Arjun Mehta is a cloud infrastructure consultant specializing in bare-metal architectures, network routing, and high-traffic database clustering.
Frequently Asked Questions
This guide covers the practical decision points — pricing, performance, and when it makes sense for your situation — based on current 2026 data.
Pricing varies by provider and plan tier; see the cost breakdown section above for current ranges and what's actually included at each price point.
Look closely at uptime guarantees, renewal pricing (not just the first-year discount), and how responsive support actually is — all covered in detail in this article.
Hosting Captain has been exceptional for my e-commerce store in Pune. The NVMe SSD speed is
noticeable, and their support team responds within minutes. Highly recommended for any
Indian business!
Ryan John, Pune
Great Value for Money
Switched from a US-based host to Hosting Captain and my website loads 3x faster for Indian
visitors. The free SSL and cPanel are great, and the pricing is unbeatable. Very satisfied
customer!
Priya Mehta, Mumbai
Reliable VPS Hosting
I've been using their VPS plan for 2 years now. 99.9% uptime is not just a claim — it's
reality. My client projects run without interruption. The KVM virtualization gives me full
control I need.
Amit Kumar, Bangalore
Excellent 24/7 Support
The support team helped me migrate my entire WordPress site at 2 AM without any downtime.
This level of service is rare in Indian hosting. Worth every rupee!
Sunita Patel, Ahmedabad
Perfect for Startups
As a startup, budget matters. Hosting Captain's Business plan covers everything we need —
multiple websites, free SSL, daily backups — at a fraction of what international hosts
charge.
Vikram Singh, Delhi
Professional Dedicated Server
Our high-traffic news portal needed a dedicated server. Hosting Captain's DS Business plan
handles 100K+ daily visitors effortlessly. Their team provisioned everything within 4 hours!
Meena Krishnaswamy, Chennai
Trusted Technologies & Partners
Start Your Website with Hosting Captain
From personal blogs to enterprise solutions, we've got you covered!